Greg Ordy
The Beverage antenna is one of the earliest and most effective low frequency receiving antennas. Named after it's inventor, Harold H. (Henry) Beverage, the antenna dates back to the early 1920's. An interesting letter from him to Victor Misek, W1WCR, author of The Beverage Antenna Handbook, is located on W1WCR's web site. This letter describes how Beverage developed the antenna which was named after him. Some historical comments on the life and work of Beverage can be found on The Broadcast Archive web site. Beverage lived from 1893 until 1993. As time goes by, I suspect that period will be recognized as one of tremendous discovery and invention, covering flight from Kitty Hawk to the moon, nuclear weapons and power, and radio/television (to name but a very few developments).
The purpose of this page is to examine the performance of a typical Beverage when all variables except length are held constant. For me, the Beverage represents a yardstick which can be used to compare the performance of other receiving antennas. All of the results on this page were obtained via antenna simulation, using the EZNEC antenna modeling software (version 3 of the software is necessary in order to compute the RDF metric). There is no reason why other modeling packages would not provide similar results. The models I used and summary spreadsheet can be downloaded from links found later on this page.
As will be seen, the Beverage antenna has a very low gain, in fact a negative gain with respect to the isotropic radiator. As a result, the antenna sees little use as a transmitting antenna, although I have read that the military has used them in that application. The Beverage shines as a receiving antenna for low frequencies. Typical frequencies range from 500 KHz to 10 MHz, although these are not absolutes. On this page, all modeling will be at 1.83 MHz, within the DX window of the amateur radio 160 meter band. The antenna is a nonresonant antenna, and will operate over a wide range of frequencies (not just a single frequency or band) It is a good receiving antenna because it is directional, reducing noise pickup in all directions except the one that it is pointing in. The S/N (signal to noise) ratio of a receiving antenna is directly related to its directional sharpness. Some of my comments and opinions on low frequency receiving antennas can be found on another page.
A Beverage antenna is long (ground distance), measuring from hundreds of feet to perhaps 1500 feet. This is it's main drawback - it does not fit into many home lots. Since the antenna becomes highly directional as it gets longer, you would probably need several to cover the world. Given 40 acres of land, and less than $100 (USD) in parts, you could build an exceptional set of Beverages that would cover a number of directions. The expensive part is that 40 acres.
Here are some references for further Beverage information. Additional links can be found on my Resources page. Searching for Harold Beverage on any decent search engine should return a number of interesting hits.
ON4UN's Low-Band Dxing, By John Devoldere, ON4UN. An entire chapter on receiving antennas, with extensive Beverage information.
The Beverage Antenna Handbook, by Victor Misek, W1WCR. Now up to the third edition. Devoted entirely to the Beverage antenna.
DXing on the Edge, by Jeff Briggs, K1ZM. Basic but practical Beverage information mixed in with a detailed history of the 160 meter band.
Beverage Interviews. Two Beverage interviews (general interest)
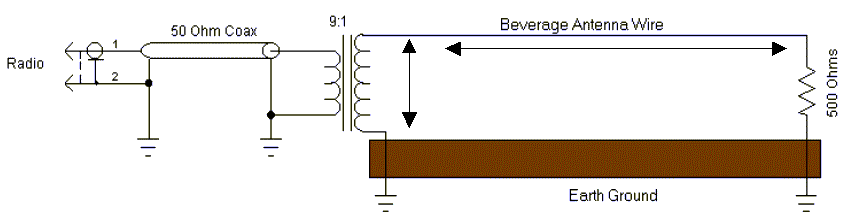
The Beverage antenna is nothing more than a long wire, parallel to the ground, placed approximately 6 feet off of the ground. The antenna is fed at one end, usually using a transformer to convert the nominal 450 ohm impedance down to the common 50 ohm impedance of coaxial transmission lines. The other end is terminated to ground through a termination resistor, which has a value of approximately 500 ohms. With the termination resistor, the antenna displays a unidirectional pattern, pointing from the feed point through the termination resistor (the termination resistor points in the forward direction). If the termination resistor is not used, the antenna displays a bi-directional response pattern.
|
|
| Basic Beverage Antenna |
Even with such a simple design, there are several variables which influence the characteristics of the Beverage. The primary ones are briefly discussed in the following table. Please consult the references for additional details.
|
Primary Beverage Variables |
|
| Length | This page is all about the effect of Beverage length. In general, the longer the better. Typical lengths range from 1/2 to 4 wavelengths. Indirectly, that implies that frequency impacts Beverage performance. |
| Height Above Ground | Typical Beverage heights range from 3 feet to 15 feet off of the ground. Lower Beverage's have a lower output signal, but smaller side and rear lobes. I have selected a 6 foot height since that is the lowest height where people and animals can easily pass under the antenna. |
| Ground Quality | Ground quality has to do with the resistance of the ground. For the most part, a Beverage works better over poorer quality soil. This is especially true as the frequency becomes lower and lower (under 500 KHz, for example). Although salt water is considered a wonderful ground for a vertical antenna, the Beverage will not operate very well if located over salt water (since it is relatively very conductive). |
| Wire Termination | The Beverage antenna wire needs to drop to ground level at each end. Some sources strongly suggest a gentle slope towards ground in order to minimize signal pickup due to the vertical drop. Other sources claim that a vertical drop is a vertical drop (in a vector sense), and whether you drop 6 feet in place, or drop 6 feet across a span of 60 feet, you will pickup the same amount of undesired signal. |
| Termination Resistor |
The termination resistor for a Beverage typically ranges between 450 and 600 Ohms. I have selected 500 ohms as a representative value. It is selected to match the impedance of the antenna. The termination resistor's job is to absorb undesired signal (and noise) coming from the rear direction. If the value does not match the impedance of the antenna, a mismatch will occur at that boundary, and some signal (or noise) will be reflected back towards the feed point. This will reduce the front to back ratio, since unwanted energy is being sent to the receiver. |
| Velocity Factor | We are familiar with idea of velocity factor with respect to transmission lines. In general, the speed of light slows in any medium other than a vacuum. The velocity factor of a Beverage is also a function of the ground under the Beverage. For this reason, the velocity factor is often difficult to know. In my antenna simulation, the velocity factor is not needed. This is not true for other approaches to computing Beverage metrics (such as length). |
Other factors, such as wire material, are of secondary importance. I tend to use bare aluminum electric fence wire, which is very inexpensive. Insulated copper wire would probably provide better performance, both in terms of weather protection and (to a much smaller extent) signal output level. Support poles are usually made from wood or fiberglass. Do not be afraid to guy your Beverage, so that the antenna does not droop an excessive amount. Where I live, Beverages tend to go up in the fall, and down in the spring. As a result, I do not need long term construction materials and techniques.
The impedance matching transformer is usually wound on a small ferrite core. The references include complete parts and construction details. Complete transformers are also available from several commercial sources. I wind my own - it really is simple.
This Beverage description has been kept very simple. Please consults the references for much more information. There are many Beverage variations which are worth considering in order to get the most out of the substantial investment in physical space.
In order to simulate an antenna we must first create an antenna model. In all cases of modeling and simulation, one must remember that a simulated model may not represent the real world. In this case, the consensus appears to be that a Beverage antenna modeled on NEC-2 provides good and useful results.
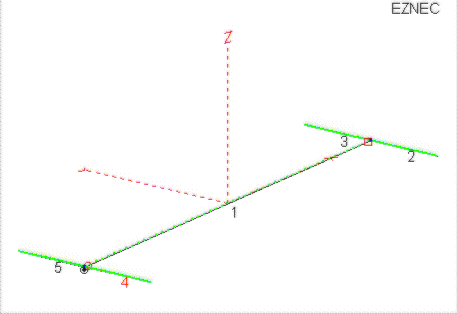
I decided to use the modeling approached described in ON4UN's Low-Band Dxing book. The model is described on page 7-5, section 3.2 (third edition). Each end of the Beverage is connected to two additional termination wires, each 1/4 wavelength long, perpendicular to the Beverage, coaxial with the other wire, and parallel to the ground. The radiation from the termination wires will cancel, leaving us with nothing more than an appropriate impedance connection point. The source is placed at one end of the Beverage wire, and the termination load resistor is placed on the other end. You would not build an actual Beverage using this design, but it appears to be an effective model. Real Beverages are usually terminated with ground rods.
The 5 Beverage wires are shown in the following picture, produced by the EZNEC software.
 |
| Beverage Model Wires |
Wire #1 is the antenna. Wires 2, 3, 4, and 5 are each 136 feet long, and represent the four, 1/4 wavelength termination wires. All of the wires are parallel to the ground, and are 6 feet off of the ground.
I mentioned at the beginning of this page that I was going to vary the length of the Beverage while holding all other aspects of the model constant. Here are the values of the constants.
The frequency is 1.83 MHz.
The termination load is 500 Ohms, pure resistance.
The ground type is Real/High Accuracy.
The ground description is Very Good, (S/m = 0.303, Dielectric constant = 20). This is the sort of ground in the area where I live.
The wire loss is copper.
The plot type is 3D, and the step size is 3 degrees.
Each wire is #12 size, and modeled with 48 segments.
Please download the description file for the actual model used.
One if the major goals of this page is to compute the RDF, which requires knowing the average gain of the antenna. The average gain is determined by computing the gain at a set of points, and dividing by the number of points. The set of points is indirectly specified by the step size EZNEC variable, which I have set to 3 degrees. This means that the true 3-dimensional nature of the antenna is approximated by a set of sample points, which are spaced 3 degrees from each other (across the simulated sky). As with most approximations, the greater the number of points, the more accurate the results. Another way to say this is that the behavior of the antenna is unknown except at the sample points. If the points are too far apart, we may miss a very small but yet interesting behavior. EZNEC does not allow a step size of 1 degree, but I could have selected the most detailed setting of 2 degrees. Through experimentation, I found that the time necessary to run a simulation with a 2 degree step size went up by a factor of 2 from a 3 degree step size. Since I made several hundred simulations to gather the overall data, this extra time was important. I also compared the results between a step size of 2 and 3 degrees. There were only very small changes, such as a change in a few hundredths of a dB. I did not consider this to be significant, and used a 3 degree step size. The program default step size is 5 degrees.
Since I wanted to compute the RDF, I needed EZNEC to compute the average gain. The Plot Type must be set to 3D in order to obtain the average gain. So, all of my results were taken from 3D plots.
For the model described, I ran simulations at 10 foot intervals from 250 feet through 1800 feet (length of the Beverage). This corresponds to approximately 0.5 to 3.3 (free space) wavelengths at 1.83 MHz. At each point I recorded a number of results. All of the results were placed in an Excel spreadsheet. Excel was then used to produced the graphs shown in this section. I also made a number of additional simulations at even longer lengths in order to determine certain points, such as the point of maximum RDF. You can download the model and the spreadsheet from links presented at the end of this page.
Whether on a graph, or whether in the spreadsheet, the data will reveal various nulls. When looking at this data, you should not draw the conclusion that the maximum magnitude of the null is shown. Nulls tend to be very deep, and very narrow. Most of my data collection was based upon making stepped measurements through some range. I tried to pick step sizes which were not so large that nulls were missed, but not so small that it took forever to collect the data. In some cases, I have seen changes of literally a few feet or a few Ohms add 10 to 20 dB to the depth of a null. In practice, understanding the absolute depth of a null is not important since its narrowness makes it difficult to exploit. My thinking is that I don't want to miss a null, but I also don't want to spend too much time trying to see if the null is -50 dB deep, or -60 dB deep. Nulls may also be frequency sensitive.
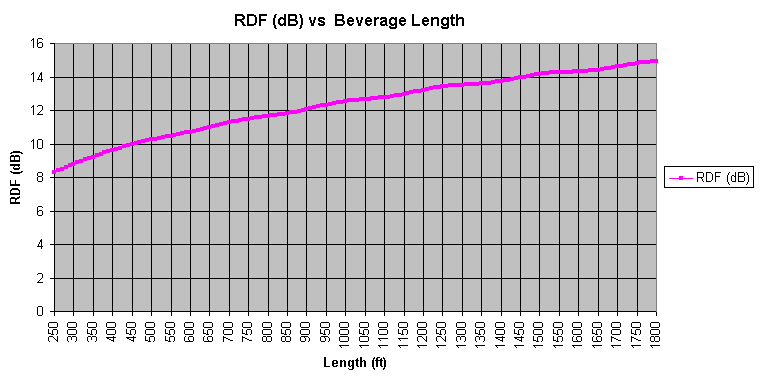
I first described the RDF (receiving directivity factor) metric on another page. This metric is the difference between the maximum gain of an antenna and its average gain. I have been developing the opinion that it is the single best metric to predict and rank receiving antenna performance. Here is the graph of RDF versus length.
 |
| Graph 1 - RDF Versus Length |
The RDF has a minimum value of 8.3 dB, for a 250 feet long Beverage at 1.83 MHz, modeled as previously described. The RDF monotonically increases as the Beverage becomes longer. At 1800 feet, the RDF is 14.92. This span of 6.6 dB takes us from what would be considered a poor antenna to an excellent antenna. I find it exciting to think that it might be possible to locate the set of (useful) receiving antenna designs within this relatively narrow range. Certainly we have a case where a single dB matters a great deal.
I continued to adjust the length of the Beverage, looking for a maximum value. At 6000 feet, the RDF reached it's maximum value of 18.16 dB. Beyond this length RDF did fall off, although it was still 17.06 dB at 8000 feet.
The rate of change in the RDF slows down with increasing length. Across the first 300 feet (250 - 550 feet) the RDF increased by 2.16 dB. In the last 300 feet (1500 - 1800 feet) the increase in RDF was only 0.76 dB. If you take the RDF mid point (11.61 dB), it occurs at 790 feet. This means that you can achieve 1/2 of the RDF difference between end points (in this single example) for a cost of 35 percent of the length difference. Seems like a good deal.
While RDF increases with length, the elevation angle of maximum gain decreases with length. This is almost a one - two punch, since the lower elevation angle is more favorable to DX than the higher angle. In other words, a longer Beverage means increased RDF at a more favorable elevation angle.
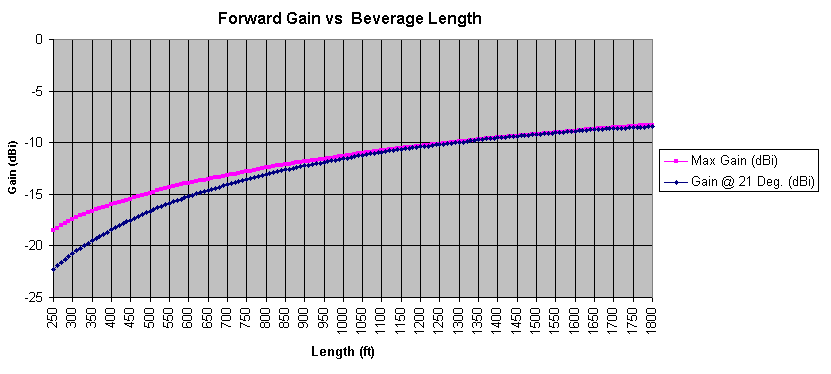
I recorded the forward gain in two different ways. First, I measured the absolute maximum forward gain. As the Beverage becomes longer, the maximum gain always increased. But, the elevation (take-off) angle of maximum gain slowly drops, from 66 degrees to 18 degrees. In dBi, the gain goes from -18.53 dBi to -8.31 dBi. Now we can see why a Beverage is usually not used for transmitting. A half-wave dipole or quarter-wave vertical, even a poor one, probably has a positive gain with respect to an isotropic radiator. This is a difference of approximately 10 to 20 dB, which is a substantial difference.
I also measured the forward gain at a take-off angle of 21 degrees. I selected this angle because it is a typical DX angle.
 |
| Graph 2 - Forward Gain Versus Length |
At the 250 foot length, the maximum gain is -18.53 dBi. At that same length, the gain at a 21 degree take-off angle is -22.27 dBi. As the Beverage gets longer, the two curves slowly overlap, since the take-off angle of maximum gain drops to 21 degrees (and eventually goes under 21 degrees). For all practical purposes, the two curves start to overlap at approximately 1200 feet. At 1800 feet, the maximum gain is -8.31 dBi, at an elevation of 18 degrees.
As the antenna becomes even longer, the gain continues to increase, and the elevation angle continues to drop. The gain peaks at a length of 6000 feet. The gain at that length is -5.38 dBi, and the take-off angle is 9 degrees. 9 degrees may be too low of an angle for typical DX conditions. If we consider the gain at 21 degrees, the gain peaks at an antenna length of 2500 feet. The gain at that length, at 21 degrees take-off, is -7.82 dBi.
As we move from a 250 foot to 1800 foot Beverage, the gain at a typical DX take-off angle increases by approximately 14 dB. The gain increase is monotonic. Gain always increases, it never decreases, either at the maximum gain angle, or at 21 degrees.
As with the RDF, the rate of change of the gain slows down with increased antenna length. If we select a length so that we achieve one-half of the overall gain difference, that length would be 590 feet (-22.27 dBi + (14 dB/2) = -15.27 dBi).
As the Beverage becomes longer, the angle of maximum gain monotonically drops. When the length is 250 feet, the take-off angle is 66 degrees, a high angle that is not usually useful for DX. Usual DX take-off angles range between 10 and 30 degrees.
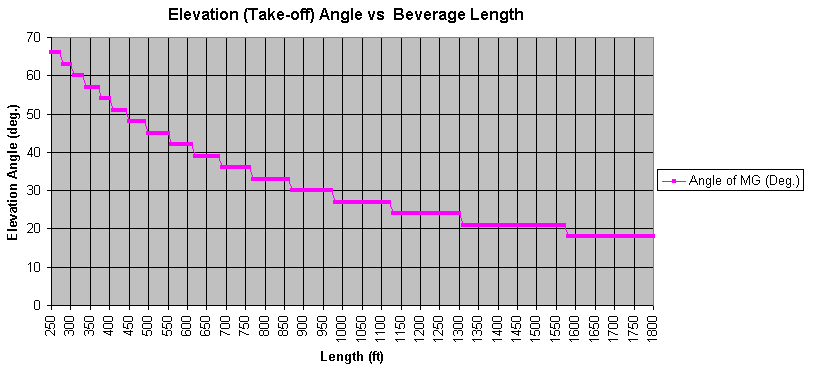 |
| Graph 3 - Elevation Angle Versus Length |
The first thing we notice about this graph is that it is not continuous, but steps in units of 3 degrees. This is due to the simulation parameters, and the selection of the angular spacing in the three-dimensional grid (EZNEC step size). In other words, this graph is an approximation of the real data. Samples are computed every 3 degrees. If you draw a smooth curve through this graph you will have the actual elevation angle.
As we have seen before, the rate of change is faster at shorter antenna lengths. The half-way point between 66 degrees and 18 degrees is 42 degrees. The take-off angle reaches 42 degrees when the antenna is 570 feet long.
The elevation angle continues to drop as the Beverage becomes longer. At a length of 8000 feet, the take-off angle is 6 degrees. It clearly cannot go below 0 degrees, and I do not know if it stops before 0 degrees.
The 3 dB beamwidth is a measure of the size of the forward lobe in the azimuth plane. It is an angle, measured in degrees, and is the angle necessary for the maximum gain to fall off by 3 dB in each direction.
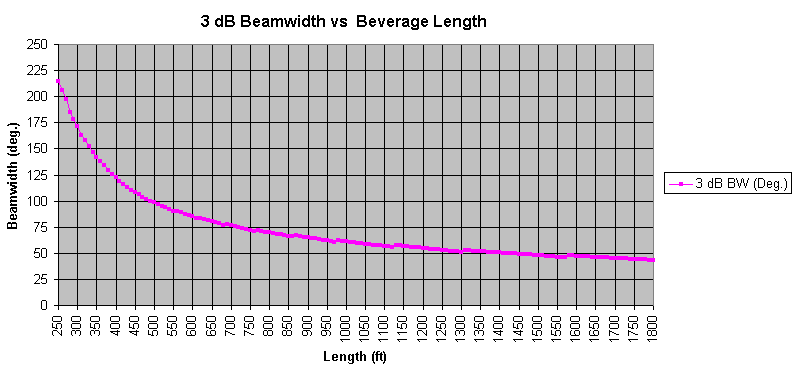 |
| Graph 4 - 3 dB Beamwidth Versus Length |
The beamwidth starts off quite wide, 215 degrees for a 250 foot long Beverage. The beamwidth drops to 43.2 degrees for an 1800 foot Beverage.
It is interesting to note that unlike all previously presented measurements, which changed monotonically, the reported beamwidth does actually back up a few degrees from time to time. These are the very small spikes on the graph. I do not know if this is a true characteristic of the antenna, or, some artifact of modeling and simulation. I would tend to believe the latter.
It is also possible to measure the 3 dB beamwidth in the elevation plane. Although I did not record that data, the trend is the same as for the azimuth plane. The lobe narrows as the antenna becomes longer. If you combine the azimuth and elevation beamwidths with the take-off angle, the picture that emerges is of a rather large front lobe that both narrows and tips down as the antenna becomes longer.
Up to this point, the data presented has been almost boring. That will now change. The characteristics described to this point slowly change and become subjectively better as the antenna becomes longer. It is now time to consider the aspect of the antenna that undergoes periodic swings - the rearward gain. Note that I said rear gain, not front to back ratio. Of course the front to back ratio is the forward gain minus the rearward gain. If you want to know the specific front to back ratio, you can take the forward gain (already presented) and subtract the rearward gain. Of course the front to back ratio is a function of the take-off angle.
I considered the rearward gain at a set of elevation angles; 21, 33, 45, 57, and 69 degrees. There is noting special about these values. The following graph shows the gain at those angles, and the maximum forward gain, for reference. The front to back ratio is effectively the distance between the maximum gain and any of the rearward gain curves.
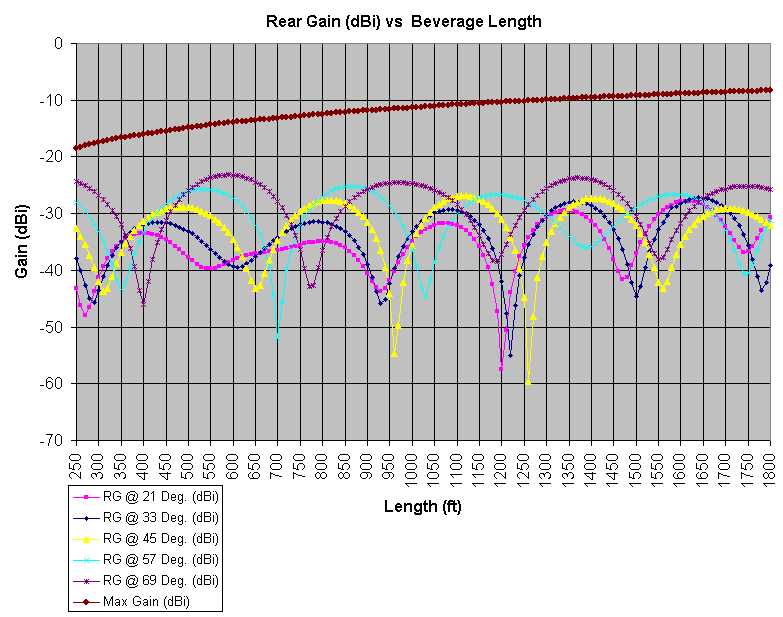 |
| Graph 4 - Rearward Beverage Gain @ Several Elevation Angles (Maximum Gain shown also) |
While the rearward gains periodically changes by up to 35 dB, the RDF (Graph 1) changes very slowly, and only grows. This shows that although the rear response of the antenna is very sensitive to antenna length, the impact on RDF is minimal. RDF is based on the average total antenna response. Does this imply that the rearward response is unimportant? Not at all. It does show that what is happening in the rear direction does tend to be a form of zero-sum game, where dramatic nulls are balanced by relative bulges at other angles. If the null happens to occur at a direction that matches an incoming undesired signal, the value of the null will be very high. While the data presented here is for a single azimuth angle, we can safely assume that this pattern of null shifting is present over the entire back portion of the antenna response.
Every downward peak represents a null at that elevation angle. As expected the nulls are very narrow. Several trends are apparent in the data. First, the spacing between nulls is not constant. It's also obvious that the magnitude of the nulls is not constant, and does not follow any obvious pattern. It does appear that the deeper the null, the narrower the null.
There does appear to be length ranges where certain aggregate and notable behavior is present. The length region around 1200 to 1250 feet contains the three deepest nulls. Nulls also group at other ranges. 270 to 400 feet, 650 to 770 feet, 930 to 1050 feet, 1200 to 1250 feet, 1470 to 1560 feet, and 1730 to 1800 feet are regions of multiple nulls.
Are these ranges important? Are any ranges important? If we are building a real Beverage, are there certain ranges that we should try to use? Are there ranges to avoid?
Some authors have tried to define suggested Beverage lengths. I would like to consider the results of Victor Misek, W1WCR, in The Beverage Antenna Handbook (second edition), and John Devoldere, ON4UN, in ON4UN's Low-Band DXing. I'm going to compare their results against the rear gain results which I obtained by antenna simulation.
If your goal is higher gain, higher RDF, or lower take-off angle, you should increase the length of your Beverage, at least according to my simulations. If you are trying to achieve a rear null, however, length does matter, and increasing length is not the simple answer it otherwise is. Several sources have attempted to address the issue of determining Beverage lengths that are preferred because their rear response is minimized, according to some set of criteria. I would like to put three of the ones that I know about in a table, and see what conclusions, if any, we can draw.
The first source is the second edition of The Beverage Antenna Handbook, by Victor Misek, W1WCR .He develops what he calls the Conic Front to Back Ratio (CFBR), and calls Beverage antennas which operate at CFBR maximums to be operating at the Cone of Silence (COS) mode. The basis of his computations appears to be formulas which have been developed for wave antennas (page 25). For a velocity factor of 0.89, and a loss factor of 0.70, Figure 8, page 28, plots the CFBR versus antenna length. His suggested lengths, taken from the plot, appear to be 0.54, 1.08, 1.65, and 2.2 wavelengths.
The second source is ON4UN's Low-Band DXing. On page 7-9 of the third edition, the author develops his own Cone-of-Silence lengths, without explicit reference to the W1WCR work. As in the case of the W1WCR work, the C-O-S lengths are claimed to occur every 1/2 wavelength, and be less outspoken as the antenna becomes longer. It's not clear to me what the exact basis of his computation is, although reference is made to a 30 degree wave angle. The 160 meter length suggestions are in the form of a range. The data I will report in the summary table is the center point of range.
The third source is my results, presented on this page. My suggested lengths come from simply looking at the rear gain graph, and noting where the nulls tend to group together. In fact, I suggested the ranges in the previous subsection. Each number I put in the table is the center point of a range.
Here is the table of the suggested lengths. When necessary, I have converted meters to feet. This table is for the 160 meter band. In fact, my results are for 1.83 MHz. The goal all these suggestions is to create a Beverage which has a relatively large front to back ratio at some rear take-off angle (but not all take-off angles - that's impossible).
|
Suggested Beverage Lengths (160 meters) |
||
| W1WCR | ON4UN | W8WWV |
| 290' | 286' | 335' |
| 581' | 563' | 710' |
| 887' | 853' | 990' |
| 1183' | 1122' | 1225' |
| ----- | 1378' | 1515' |
| ----- | ----- | 1765' |
The ON4UN results are uniformly shorter than the W1WCR results. The W1WCR results, however, are well within the range in the ON4UN data. My results suggest longer lengths than both other sources. My results are beyond the upper limit of the ON4UN range. In general, my results suggest that the Beverage be about 100 feet longer than the other sources (don't forget that my results are based up a set of assumptions that are fixed for the entire set of simulations).
Can we draw any conclusions from this data? For me, I believe that the differences are due to the different approaches taken to arrive at a conclusion. Given variations due to frequency, height above ground, velocity factor, loss, ground quality, termination resistance, and most importantly the definition of minimized rearward response, it's hard to call these results necessarily inconsistent. What appears certain is that the rear response of a Beverage has sharp nulls at a broad range of elevations angles that come and go as a function of length. Differences in length as small as 30 feet make a substantial difference. This is a relatively small percentage of the overall Beverage size.
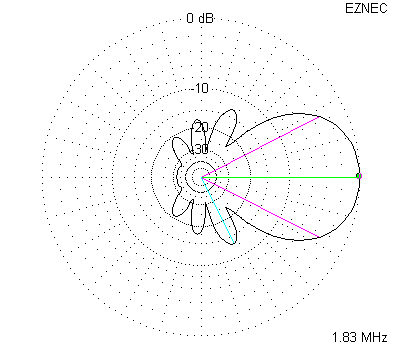
To get a better sense of these rear nulls, here are plots of the elevation and azimuth response of a 1225 foot Beverage. Note the very specific lobes. As the length of the Beverage changes, these lobes undulate, sending nulls across the rear and sides of the antenna. Still, even with all of this rear null movement, the overall RDF changes slowly, and increases with increased Beverage length.
 |
 |
| 1225 Foot Beverage Azimuth Plot (at 24 degrees Elevation) | 1225 Foot Beverage Elevation Plot (at 0 degrees Azimuth) |
I have placed pattern animations on another web page. These animations make it easier to visualize the process of rear null movement as the Beverage grows in length.
If your goal is increasing RDF, you should try to build the longest Beverage that you can. But if your concern is nulling certain noise/signals coming from the rear of the antenna, the periodic and deep nulls should be exploited. Given all of the variations and factors, I doubt if it is possible to precompute the perfect length for your circumstances. Changes of even 30 feet in length can change the rearward gain at a particular elevation angle by 20 dB. All this suggests to me that I wish I had a variable control on my Beverage which I could use to slightly change its length so that I could tilt the rearward null up and down. In operation, I would turn that control back and forth until I obtained the best reception on the desired signal. From time to time, and signal to signal, the optimum setting of the knob would change. This sort of adjustment might also be helpful if the Beverage were used on more than one band.
The most obvious approach is to literally change the physical length of the Beverage. A set of relays could be used to add or remove sections of antenna wire. While possible, it doesn't seem very practical. It's also a bit hard to dynamically alter the height of a Beverage, or the ground under the antenna. By process of elimination, it seems as if the only hope we have for creating a practical Beverage that can polymorph into one with different behavior is to change the termination resistor.
ON4UN suggests (page 7-13) exactly that - changing the termination load for the purposes of adjusting the electrical length of a fixed physical length Beverage in order to take advantage of the Cone-of-Silence phenomena.
In order to investigate this in my simulation environment, I began by selecting a Beverage length that appeared rather boring. According to my results (see Graph 4), a Beverage of 1100 feet was not near a null at any of the measured take-off angles. I then varied the termination resistance, recording the response changes. Given my existing results, one can see if the change in termination caused the results to change from the original 1100 foot results.
I set the length of the Beverage to be 1100 feet, and varied the value of the termination resistor from 250 to 700 Ohms, in steps of 25 Ohms. My hope was to see substantial movement in the rear nulls. Before getting into the results, let me mention that the remote control of a resistance suitable for a Beverage termination is not that difficult. Usually, a variable resistance photocell is tightly coupled to a light source. The light intensity is controlled from the radio shack (via a simple power supply), and the resistance of the termination changes out at the Beverage. One device that combines the light source with the photocell is called a Vactrol. One of my favorite sources for information on remote control termination of Beverage and other receiving antennas is the web site of Mark Connelly, WA1ION. His site contains a large amount of receiving antenna information.
Sadly, the overall influence on the Beverage's pattern was less than hoped for. An animation can be found on my Beverage Pattern Animation page. Changes to the pattern were minimal to negative. The only positive aspects of the termination value changes were at 325 Ohms, where the rearward gain at 45 degrees elevation decreased by 3 dB, and at 69 degrees, where the gain decreased by 1.5 dB. Since these were rearward gains, decreases are a good thing. Please check the spreadsheet for all of the details.
I did not get too excited by these small differences. Is this a signature of all Beverage lengths, or perhaps some aspect of an 1100 foot Beverage? Without answering that question, I decided to include reactance into the termination permutations. This idea came from page 7-13 of the ON4UN book. For whatever reason, he only suggests adding an inductance (positive reactance) to the termination point. I decided to fix the resistance at 500 Ohms (since that seemed like a good value), and to vary the reactance from a negative (capacitance) to positive (inductance) value.
The ON4UN book, in its example, used an inductance with 250 ohms of reactance. I used that as a guide to help suggest a reactance range to search. In the end, I searched from +800 Ohms to -2000 Ohms. Without exhaustively simulating every possible value, I looked for interesting regions where the rearward gain dropped. An interesting dip occurred at a reactance of -120 Ohms. With -120 Ohms of reactance in series with the 500 Ohms of resistance, the rearward gain at a take-off angle of 21 degrees decreased by nearly 20 dB. At 33 degrees, the rearward gain decreased by 6 dB. At the same time, the remaining gains were largely unchanged. This suggests that we do not need to make anything adjustable, but that we should just add -120 Ohms of reactance (for this antenna length). The RDF also increased by approximately 0.1 dB. Perhaps that small improvement is enough to pay for an added 20 dB of null in one portion of the rearward direction?
This experiment and result was similar to the ON4UN example in that adding reactance to the termination added performance in the form of a deeper rearward null. The only difference of substance was that I needed capacitive reactance, whereas his example only talked about inductive reactance. One final point. When one introduces reactance at the termination side of Beverage, the feed point impedance will also change. ON4UN suggests that the feed point reactance be cancelled.
The detailed simulation results can be found on the spreadsheet. An animation can be found on my Beverage Pattern Animation page.
I was encouraged to see a substantial change in the case of a reactive termination - especially since changes in the resistance did very little (to help). I was hoping that it would be possible to add a variable resistance or reactance, and be able to effectively steer the null, without changing the RDF, or other aspects of the antenna. The one variable which I had not yet changed was the antenna length. I picked 1100 feet because it seemed like a boring or calm region. Perhaps to achieve the largest impact I would need to select another length? This could be an important area for further simulation. Certain lengths might exist where variable termination makes a substantial difference. I did not want to search that large space when writing this page, but I did decide to investigate the behavior at 1220 feet. That length was right in the middle of a number of deep nulls, in fact, the deepest nulls found.
As before, I began be simply varying the termination resistor value. Here is a graph of the rear gain of the 1220 foot Beverage, as the termination was varied from 250 to 700 Ohms.
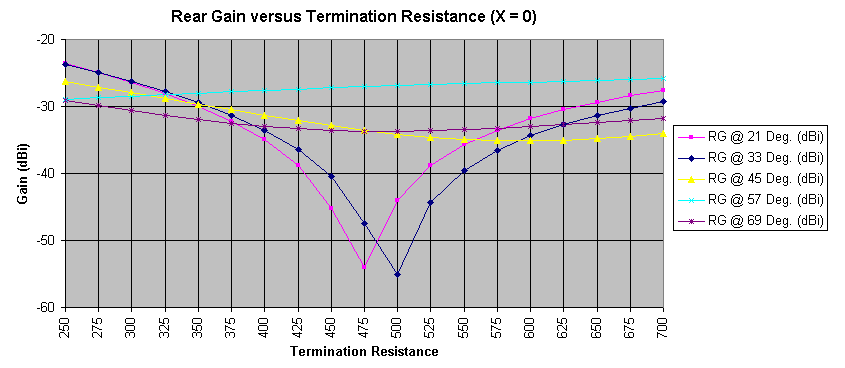 |
| Graph 5 - 1220 Foot Beverage Rear Gain as a function of Termination Resistance |
I have been using a typical value of 500 Ohms, which looks nearly perfect for 33 degrees, but it's clear that 475 Ohms is better for the 21 degree take-off angle. Several thoughts arise from this graph. First, changing the termination resistance can change the rearward performance of the antenna. There is no single correct value. The rearward gain (in this example) could change by 20 dB within a span of 75 Ohms. Since null dips can occur at difference resistances, and they are narrow (as nulls usually are), it seems very desirable to have a remote variable termination. If you can't do that, at least spend some time experimentally adjusting the antenna so that you hit at least one null.
It's also interesting to note that the variable resistance primarily changed the 21 and 33 degree elevation angle rearward gains. If you go back to Graph 4, those are the angles that are dipping near the 1220 foot antenna length. This continues to suggest to me that if you want to be able to use variable termination to change the rearward performance of your Beverage, you should set the length of the Beverage so that it is near an existing null. This trend is even true for the1100 foot Beverage.
Next, I reset the resistive portion of the termination to 500 Ohms, and varied the reactance of the load, as I did in the case of the 1100 foot Beverage. Here are the results of that variation.
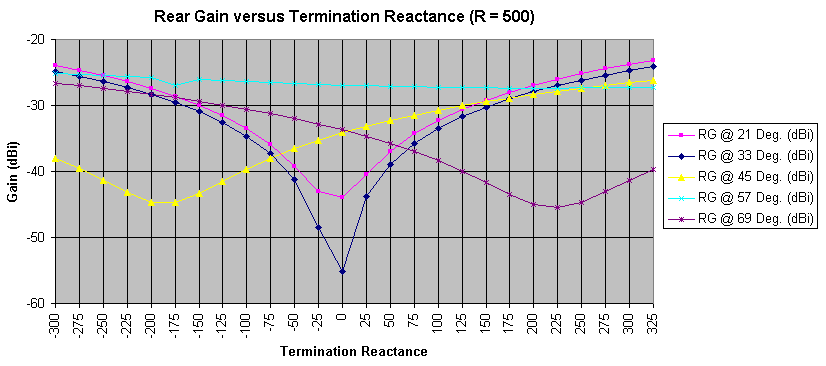 |
| Graph 6 - 1220 Foot Beverage Rear Gain as a function of Termination Reactance |
This graph is most promising because we see that by varying the reactance of the load between -250 and +275 Ohms, we can force the creation of 4 different nulls at 4 different elevation angles. The rearward gain at 45 and 69 degrees is improved by approximately 10 dB with an appropriate nonzero termination reactance. I have placed elevation and azimuth animations of this variation on my Beverage Pattern Animation page.
There is at least one more permutation - varying both the resistance and reactance of the termination. In just a few minutes of experimentation with this idea, I was able to additionally improve the rear gain (by making it less). This page is already way too long, so I'll leave that analysis for a future web page.
Do I believe that all of these numbers are absolutely true? No, but I do strongly believe the trends they suggest. Certainly if you were to change the height above ground, the ground characteristics near the antenna, or other factors, the results would change. Again, I believe that the trends would remain the same.
Are there certain magical Beverage lengths? If you only care about RDF, the answer is no. As the length increases, the RDF increases. If you care about rejecting certain rearward angles, then the answer is yes.
Except for the shape of the side and rear lobes, all other aspects of the antenna get better as the antenna becomes longer (assuming the goal is DX reception).
The following conclusions were suggested by this model and its simulations.
With the exception of rear gain, the only way to significantly improve any aspect of a (single) Beverage is to make it longer.
Rear gain is very much a function of length, and periodically does rise and fall. The period is near 1/2 wavelength, but is not constant.
The RDF increases with length, and even large variations in termination, which do change the rear pattern, do not change the RDF other than by a very small amount.
Model the parameters of your particular Beverage, and look for the rearward nulls. This information may suggest a particular length for your application.
If possible, experiment with changes in the termination resistance and reactance, especially if the length of the antenna is near some existing rearward nulls. Very small changes may substantially improve your rearward performance (but not at all elevation angles).
Another factor to keep in mind is that usually we want our Beverages to operate on more than one band. While a 1225 foot long Beverage looks like a wonderful antenna for 160 meters, it is going to be too long for 80 meters, and certainly 40 meters. By too long I mean that the pattern is too narrow, and the take-off angle is too low (unless you have room for many antennas!). If you want multiple band operation, you should consider your design on all of the bands, and hopefully find a workable compromise. I have wondered if it would be possible to build what I would call a trap Beverage, which is to say that a parallel LC trap would be used to shorten the Beverage on a higher band. In general, Beverage's are never long enough, so the idea of anything that makes them shorter may simply be amusing. If you get involved with adjustments of the termination load in order to optimize performance, you may be complicating multiple band operation.
Since an exceptional Beverage is large, other techniques can be used to improve performance without requiring so much real estate. Arrays of Beverages are now receiving a lot of attention. Null steering is another technique that can be used to improve the performance of a fixed-size Beverage. Consult the ON4UN and W1WCR references for more information.
The EZNEC model can be downloaded as file Beverage.ez.
The Excel spreadsheet of results can be downloaded as file BeveragePerformance.xls.
Back to my Experimentation Page