Data Graph
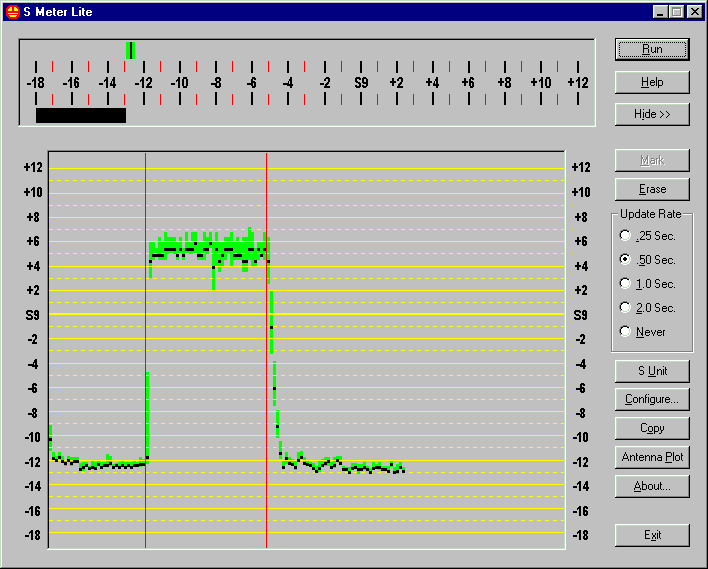
The Data Graph portion of the program window is located below the S Meter portion of the window. Here is a picture of the entire window.

This screen captures shows the S Unit scale. If you do not see the Data Graph on your screen, press the Restore button to unfold it into view.
The Data Graph contains a graph of recent S Meter data and a set of buttons that control how the data is collected and displayed. New data is added to the graph at the end of each update period. The update period ranges from 0.25 seconds to 2 seconds. Each vertical green bar represents a data report from a previous update period. The top of the bar is the maximum value in the update period. The bottom of the bar is the minimum value in the update period. The black dot on the green bar is the average value in the update period.
A new data bar is added to the immediate right of the last data bar. When the data reaches the right side of the window, the graph is erased, and data is added on left edge of the graph.
The data scale is shown on the left and right sides of the graph.
The Mark button is used to add a vertical red line to the graph. The button is enabled only when the program is running. The red line has no meaning to the program, unless you are capturing data to make an antenna pattern plot. It is provided so that you can more easily separate the graph into different regions.
The Erase button clears the graph. New data will be added starting on the left edge.
A set of radio buttons are used to control the Update Rate. Only one of the five buttons can be true at any given time, and one button is always true. When the update rate is set to Never, data will not be added to the graph, nor displayed on the top of the S Meter scale.
The scale is toggled with the dB/S Unit button. This button changes the scale of the S Meter as well as the Data Graph. Whenever the scale changes, the graph is automatically erased. The previous screen capture showed the S Unit scale. Here is a screen capture with the dB scale.

With most radios, the dB scale represents a much smaller signal range than the S Unit scale. Raw data that is below -18 dB will be shown as -18 dB. Data above +12 dB will be shown as +12 dB. In other words, the data is limited or clipped to the scale in use. You may need to use the preamp or attenuator on the radio to bring the signal level onto the middle of the dB scale.
The Configure button displays the Configuration dialog box. Configuration is described on another page.
Copy places a copy of the graph bitmap on the system Clipboard. Use the Paste command in another application to retrieve the bitmap. This capability, for example, lets you save the bitmap for future reference, or add it to a document or email.
Antenna Plot displays the Antenna Pattern Plot dialog box. Pressing this button while the program is running, and if there already exists a single Mark, will cause the automatic generation of a second Mark. In other words, this button can used to terminate an antenna pattern plot capture and then display the analysis dialog.
The About button displays the About dialog box.
The Exit button ends the program. Please note that since S Meter Lite is implemented as a Windows dialog box, the escape (Esc) key will also end the program.
Last update:Monday, November 26, 2001 10:38:45 PM
Back to the S Meter Lite Home Page