 |
 |
| Elevation Plot | Azimuth Plot |
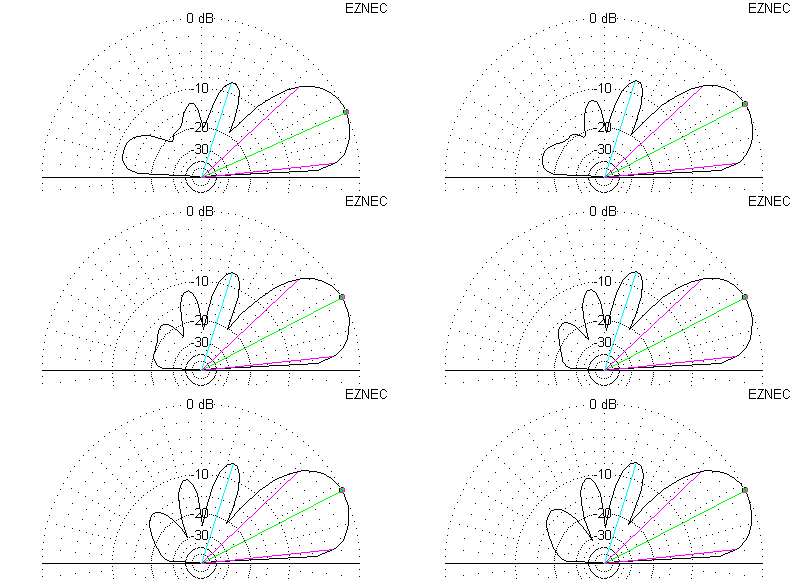
| Benchmark Beverage Animation, 250 feet through 1350 feet, at 50 foot Increments | |
Greg Ordy
As I experimented with modeling and simulating Beverage antennas, I wanted to get a clearer sense of the antenna pattern in the rearward direction of the antenna. Most aspects of a Beverage antenna change very slowly, as the antenna grows longer. Characteristics such as gain, RDF, and beamwidth, monotonically improve (for DX purposes) with increasing length. The rearward pattern, however, changes substantially and often over a very small change in length. Nulls sweep through the range of take-off angles (elevation). These nulls are often times quite valuable because they can swallow up an undesired signal or noise source. Since we are trying to improve the signal to noise ratio, it really doesn't matter if we increase the desired signal, or reduce (null) an undesired signal. Both techniques improves the signal to noise ratio.
One method of examining the behavior of the Beverage is to take a number of simulations and put various numeric results in a big table, such as an Excel spreadsheet. Trends in the data may very well become obvious in the data. The antenna pattern, however, is ultimately a three-dimensional phenomena, and slices of data through the three-dimensional space may miss something interesting. I decided to experiment with animating pattern changes. I tried animating full three-dimensional images. The results were usually not useful, as the picture was just too hard to understand in three dimensions. I did find that I could animate elevation and azimuth slices, however, and a number are presented on this page.
These animations were made by running EZNEC, and using the Edit->Copy command to put a copy of the elevation or azimuth bitmap on the system Clipboard. I then used a graphics program to take the bitmap from the Clipboard, and convert the image to a GIF format file. I saved the images in separate files. I then used a program called the Microsoft GIF Animator to take a sequence of GIFs and create a single composite GIF that held the animation. The composite file is then placed on a web page, and the browser automatically plays the animation.
In general, I selected a delay of 0.7 seconds per frame.
On my Benchmark Beverage page I presented a model of a Beverage which I used as the basis for a number of simulations. The animations in this section are based upon that model. I captured plots starting at 250 feet in length, and moved in steps of 50 feet until 1350 feet. That is 23 total plots per orientation. The elevation plot is taken through the front to back center of the antenna (0 degree azimuth). The azimuth plots are made at the elevation angle of maximum gain. Since the elevation angle slowly drops as the antenna gets longer, the elevation angle of the azimuth plots slowly drops.
The animations will run continuously. It's easy to tell when the plots return to the 250 foot length since the beamwidth is greatest at that length. If desired, you can could the Beverage lengths from that starting point. 250, 300, 350, 400, etc.. The two orientations do move in step with each other.
 |
 |
| Elevation Plot | Azimuth Plot |
| Benchmark Beverage Animation, 250 feet through 1350 feet, at 50 foot Increments | |
Even with the periodic forming of new lobes, and the movement of the nulls, the overall RDF changes slowly and monotonically, as a function of Beverage length.
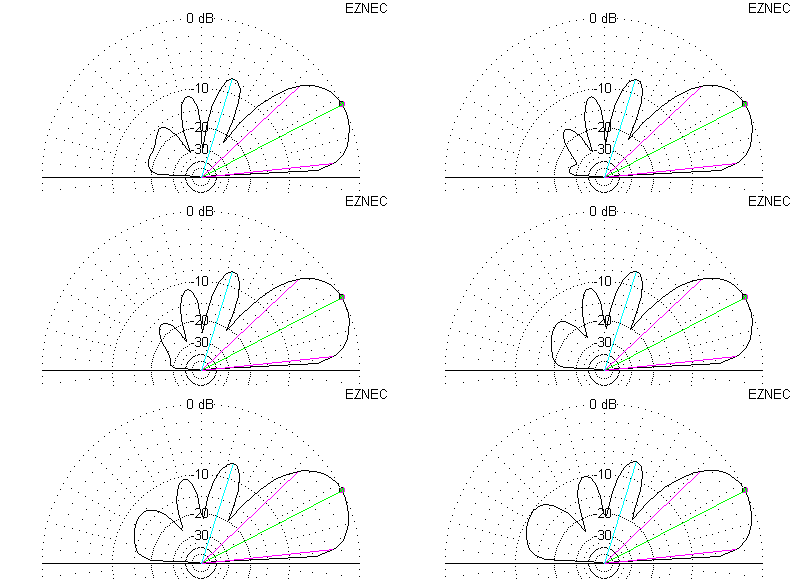
My first simulation-based exploration into polymorphing a Beverage was to vary the termination resistance of an 1100 foot Beverage. This is the Benchmark Beverage described on another page. The frequency was 1.83 MHz. The termination resistance started at 250 Ohms, and stepped to 700 Ohms in units of 50 Ohms. The animation shows the impact of the termination difference on the elevation pattern.
 |
| 1100 Foot Benchmark Beverage with Variable Resistance Termination, 250 Ohms through 700 Ohms, at 50 Ohm Increments |
You can tell when the sequence jumps from 700 Ohms back to 250 Ohms. The pattern has the biggest jump at that point.
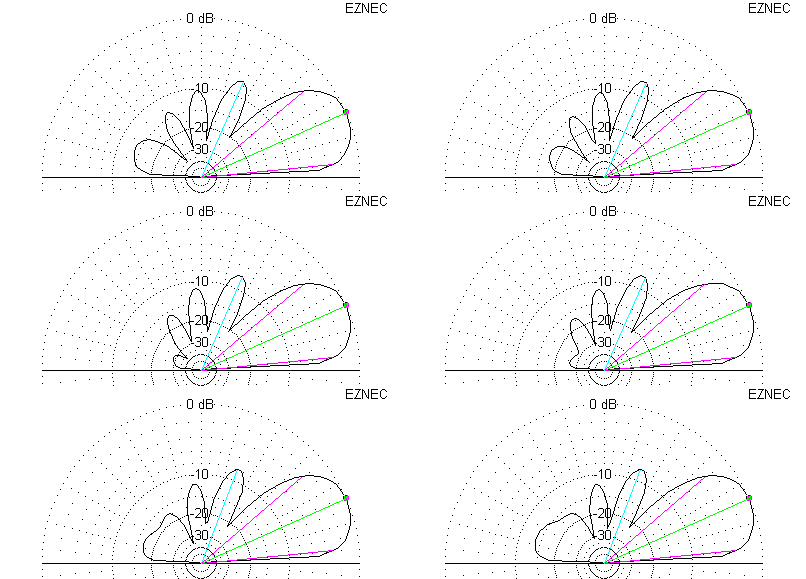
This is the same antenna as in the last section, except that the termination resistance is set to 500 Ohms, and the reactance is swept from -300 to +300 Ohms, in steps of 60 Ohms. This represents the interesting termination region, and falls on the -120 Ohm point, which was the center of the interest.
 |
 |
| Elevation Plot | Azimuth Plot |
| Benchmark Beverage Animation, -300 Ohm Reactance through +300 Ohm Reactance Termination, at 60 Ohm Increments | |
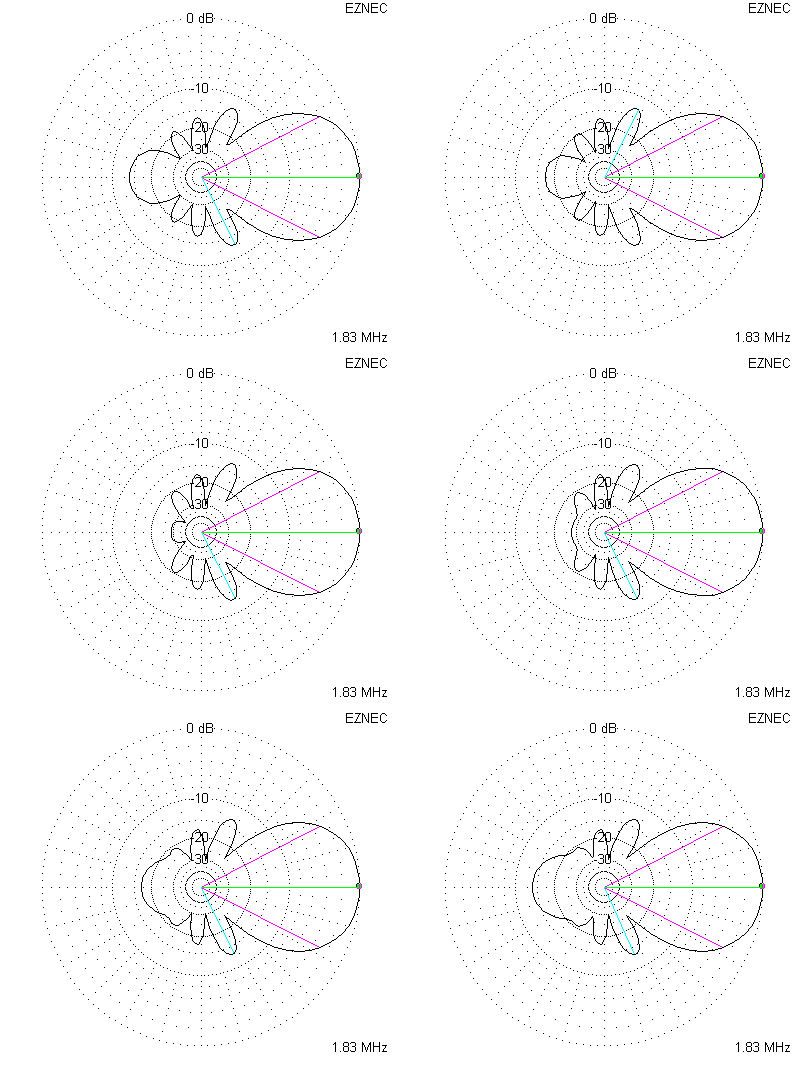
The 1220 foot length, at 1.83 MHz, is a length near several natural nulls in the rearward gain. These two animated GIFs represent the elevation and azimuth plots as that length, as a function of termination reactance. The termination resistance was set at 500 Ohms, and the reactance was varied from -300 Ohms to +300 Ohms, in steps of 50 Ohms. The choice of 50 Ohms (as opposed to 60 in the previous examples) was done to make sure that we hit the nulls shown in the more detailed spreadsheet data.
 |
 |
| Elevation Plot | Azimuth Plot |
| Benchmark Beverage Animation, -300 Ohm Reactance through +300 Ohm Reactance Termination, at 50 Ohm Increments | |
Back to my Benchmark Beverage Page
Back to my Experimentation Page