 |
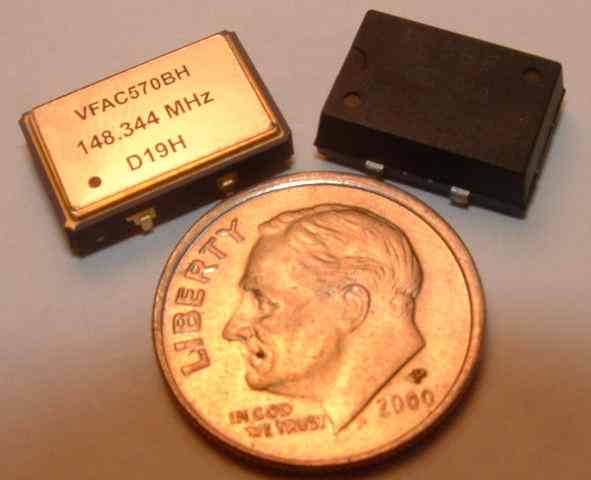
| Oscillators shown with a US dime |
Greg Ordy
The N2PK VNA RF and LO signal sources are generated by Analog Devices AD9851 DDS chips driven by a single master oscillator (clock). To date, the suggested oscillator frequency has been 148.344 MHz. That value was selected to reduce measurement noise at round number test frequencies (N2PK Part 2, page 2). While a few brave pioneers built oscillator units from discrete components, the recent solution has been to use a monolithic commercial oscillator.
The initial part selection was the Valpey-Fisher VFAC570.While this unit compared favorably to the hand-crafted parts (N2PK Part 2, page 2), it has two drawbacks. First, it costs $35 (USD) per oscillator, and the price does not decrease until you get over 100 units in an order. Their minimum order is $350. So, you have buy 10 oscillators to get into the game. The second problem is that there is an 8 to 10 week delay between order and delivery. These parameters motivate a search for a second source.
One of the possible alternatives is the Fox JITO-2. This part is available in around a week, and the cost begins at $18.38/unit for 6 units, and drops to $7.33 if you are willing to purchase 25 units. The question becomes, how does it perform in this application?
In the context of the March 2004 Group Build which I've been working on, there are 60 VNA units. It turns out that due to the timing over the last few months, I have 45 Valpey-Fisher oscillators on hand, and the remaining units are Fox JITO-2. Each group member can choose which oscillator they want, so long as I have parts. In other words, I will begin using the time-ordered list of names and ask each group member which oscillator they prefer. When I reach a count of zero on either part, the only choice will be the other part. The cost difference between the oscillators is $25. Selecting the Fox JITO-2 oscillator will drop either the kit or assembled price by $25.
The question then becomes, how do you pick between the oscillators? The purpose of this web page is to present what information I've been able to put together in the available time frame to compare the two oscillators.
I'm the first person to admit that I'm not an oscillator/phase noise expert. These tests may not be the best at highlighting the differences between the choices. My test equipment is limited as well. I will try and state the test conditions completely, so that you can draw your own conclusions, if any, from the results. Feel free to ignore my analysis.
|
|
| Oscillators shown with a US dime |
Back when I first heard of oscillators, in the 1960's, the characteristic often talked about was stability. The oscillators were based on crystals, and the waveform was very close to a sine wave. The problem would be that the frequency would drift over time. Stability was measured in ppm (parts per million), and it could be determined by connecting a perfect frequency counter to the oscillator, and letting it run for a relatively long time, and counting the total number of cycles. The difference between the counts measured and expected counts was the error, and it could be normalized to the number of errors per million clock cycles.
The Valpey-Fisher clocks are specified to have a stability of +- 100 ppm. The Fox clocks have a stability specification of +- 50 ppm. The Fox units are available in several different stability specifications, and I selected 50 ppm.
In recent years, the use of digital technology combined with analog has led to a range of new oscillator devices that require different types of analysis and characterization. In this case, the difference is that the Valpey-Fisher clock does not use PLL (phase locked loop) technology, but the Fox JITO-2 does. A key characterization becomes oscillator jitter. Jitter is the time deviation from perfection of the rising and falling clock edges. Having good stability characteristics does not say much about jitter, since jitter can average out over time. I think of jitter as oscillator stuttering, where the edges are not where they should be on an edge by edge basis. The time difference between the actual edge and the perfect edge is often measured in ps (picoseconds), so the error is small, relative to running the 100 meter dash, but it can have an impact on an electronic system.
The Valpey-Fisher clock has a jitter specification of 1 ps. The Fox clock specification is near 20 ps, although it's not clear that this is an apples to apples comparison. In particular, Fox describes their test procedure, and Valpey-Fisher just lists a number in a table. Different test procedures could lead to different results.
Jitter will contribute to phase noise. The spectral output of the oscillator will become wider, since jitter, on a cycle by cycle basis, results in a slight offset in frequency. I personally think of this as frequency smearing. A perfect oscillator fed into a perfect spectrum analyzer would show a vertical line - all of the output energy is at a single frequency. In the real world, neither is perfect, and the result is a signal with energy concentrated at the operating frequency, but with a measurable fall off to each side. This leads to one of the many definitions of phase noise - dBc/Hz. That is, the drop, in dB, of the off-frequency signal level relative to the carrier, measured in a 1-Hz bandwidth. See this link for more information on phase noise definitions.
In this application, the master oscillator drives two Analog Devices AD9851 DDS chips. These chips provide the RF and LO analog signals, and in typical operation the LO phase is accurately shifted by 90 to enable what N2PK calls sequential quadrature measurements.
Each DDS chip synthesizes a variable output frequency signal given a fixed reference frequency and a variable tuning word. Each input clock from the master oscillator will advance the DDS output to the next approximation point of the sine wave signal. Jitter coming in on the master clock will directly contribute to jitter on the output signal. At the same time, the DDS chip itself contributes phase noise due to internal errors in the computation of the sine wave shape. It would seem that this could lead to an error cascade, where jitter from the clock interacts with jitter from the DDS, creating a much worst overall output. The Fox documentation does warn against having one PLL-based device drive a second PLL-based device. In this case, however, the DDS chips are not using a PLL. There is a PLL in the DDS chips which can be optionally used to generate a 6X reference clock, but that feature is not used in this design.
While the DDS chips are subject to jitter from the master clock, what's interesting is that they are in lock-step synchronization (in normal operation), so the impact on the RF and LO waveforms will be identical. The phase shifts in the DDS chips will track, even with the influence of jitter. This tends to complicate the impact of jitter on measurements made with the VNA.
N2PK comments on the possible impact of jitter and phase noise on VNA measurements in Part 2 of his articles, page 2, the section labeled Packaged Master Oscillator.
While oscillator differences are interesting and important as an isolated topic, what matters (to me) in this situation is the impact on VNA measurements. Can we make measurements which are different solely due to the oscillator choice? How much does an oscillator imperfection work its way through to measured data? I decided to make test reflection and transmission measurements, and see if I could detect a difference.
The first test I performed was designed to see if changing the oscillator would result in a change in measured results for a single DUT (device under test). The test was a reflection measurement (impedance) of a particular coaxial cable terminated in a resistor. I have used this cable and resistor many times as I've been experimenting with different impedance measuring devices. It is described on another page. One of the reasons that I like using this combination is that it presents a range of resistance and reactance values which cycle through values typically found in antenna experimentation (where I am interested). I believe it also presents stable and repeatable impedance values.
I swept the cable from 1 MHz to 54 MHz in steps of 500 KHz, 107 total data points. I used the VNA which I assembled from the first batch of boards in the second group build. The software used to make the measurements was my own, and it creates a table of numbers in a comma separated value file, which I then read into Excel for graphing and analysis. Data was saved with a resolution of 1/10,000 Ohm (4 decimal places). The actual measurement is a measurement of the complex reflection coefficient. That data is converted into resistance and reactance by formula.
I set up the test with a Valpey-Fisher oscillator in the VNA. I captured the data, then turned off the VNA and replaced the Valpey-Fisher unit with a Fox JITO-2 unit. The data was again captured. In both cases, OSL (open, short, load) calibration was performed. An initial run of each test was discarded, only serving to provide a similar warm-up period.
All of the ADC samples were made at the 7 Hz sampling rate. This batch of VNAs includes the LT2440 ADC chip, which can perform conversions at a number of different rates. The slowest, and most accurate, rate was used.
The goal here was not absolute accuracy of the measurements, although that was not ignored. The goal was creating a test setup which was, as much as possible, identical in all aspects except for the change in oscillator. Any differences in the measured data should be due to the oscillator swap (if everything else is held constant).
The data from the two measurements was loaded into a single spreadsheet file. The following graph plots the two resistance data sets and the two reactance data sets.
 |
| Oscillator Comparison |
Although four different curves are drawn, only two are visible, since the data is so close that one oscillator curve overlaps the other. This graph, therefore, is a somewhat crude tool for viewing data differences.
I took the data and computed the RMS error for resistance and reactance. For each of the 107 frequencies I computed the difference between the two oscillators. That difference was then squared, and the squares were summed. The sum was divided by 107, and then the square root was taken of that quotient. For resistance, the RMS error was 0.0292 Ohms. For reactance, the RMS error was 0.0490 Ohms. I decided to also apply this same analysis to the reflection coefficients, which were saved as a magnitude and angle (polar form). Stepping back a moment, we have a coaxial cable terminated with a 25 Ohm resistor. This should result in an SWR of 2, which is a reflection coefficient magnitude of 0.333... We expect to see a reflection coefficient magnitude near 0333, with a phase angle that cycles through +180 to -180 degrees. Due to loss on the cable, the reflection coefficient will slowly drop as the frequency rises. Indeed, the measured data followed this trend (see how the resistance peaks and valleys are trending towards 50 Ohms, and the reactance peaks and valleys are trending towards 0 Ohms). The RMS error for the reflection coefficient magnitude was 0.0003, and the RMS error for the phase angle was 0.0627 degrees.
As I was sitting around thinking about these results, I decided to make a third measurement which was just a duplicate of the second JITO-2 run. In other words, nothing changed, except that some time (perhaps an hour) went by between the second and third run. OSL calibration was again performed. I compared the second run to the third. The RMS resistance error was 0.1034 Ohms. The RMS reactance error was 0.0777 Ohms. Note that both of these values are greater than the error between the tests run with different oscillators. That suggested to me that whatever error that was due to the oscillator change was near my ability to make repeatable measurements in this setup.
The following table summarizes the results.
| RMS Error | ||||
|
Comparison |
Resistance | Reactance | |RHO| | RHO Angle |
|
Valpey / Fox |
0.0292 Ohms | 0.0490 Ohms | 0.0003 | 0.0627 Degrees |
|
Fox / Fox |
0.1034 Ohms | 0.0777 Ohms | not computed | not computed |
The spreadsheet file, SweepDataC47.xls, can be downloaded by clicking this link.
I realized after I made these measurements that I forgot to change the master oscillator frequency setup values when switching oscillators. For the two oscillators I picked from the bags, this means an error of approximately 200 Hz. While I believe that impact on the impedance measurements would be small, it is a contributor to error that I missed.
Whenever you put a new oscillator in the VNA, it's a good idea to check the frequency, and adjust the setting in the software so that the DDS outputs are as close as possible to the expected values.
As a transmission measurement example, I decided to characterize the two crystal filters in my ICOM 706MKIIG radio. I was not able to find the specifications of the input and output impedance for the ICOM products, but the INRAD web site did describe their ICOM replacement filters, and I assumed a similar port impedance (2000 Ohms). I quickly learned that in order to make good filter measurements you need to match the input and output ports, and to provide the highest possible isolation between input and output sides. Signal leakage around the filter will compromise the measurement quality, since that leakage will appear as part of the response of the filter.
I wound two autotransformers on 1/2 inch diameter type 75 ferrite cores to match the 50 Ohm VNA port impedance to the 2000 Ohm filter impedance. A common aluminum box was pressed into service as a filter holder. Holes were drilled on the side to match the filter pins, which included 4 ground pins and 2 signal pins. Tin sheet stock was shaped into a partition which divided the inside space into a shielded input and shielded output section. BNC connectors were used to enter and leave the box. Here is a picture of the box with the case cover removed. The crystal filter is on the top of the box, and the metal case of the filter seats against the box during measurements.
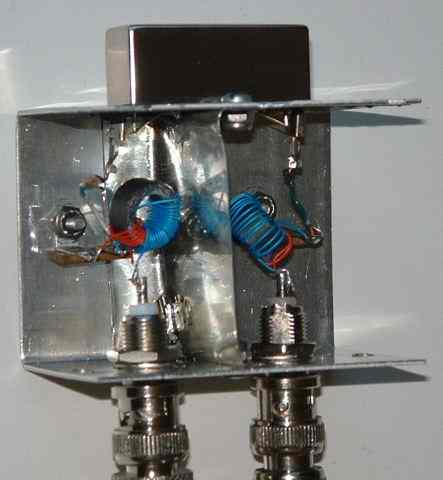 |
| Crystal Filter Test Fixture |
The transmission testing procedure has three steps - the measurement of the open RF input detector, the measurement of a through connection from the RF output to the detector RF input, and a measurement of the device under test (DUT), inserted between RF output and the detector RF input. Each measurement is composed of two readings, taken with a 90 phase shift in the LO DDS, which provides a complex value representing the open, through, and DUT value. The reduction of this measured data into the gain and phase shift through the DUT is described in the first N2PK article. In making the through measurement, I replaced the crystal filter with a wire. This means that the loss through, and effect of, the matching transformers will be removed from the computed DUT results.
As in the case of the reflection measurements, homebrew software was used to acquire data. Averaging was used as part of data collection. For each frequency, and each quadrature component, 10 sequential reading were taken, holding the RF and LO sources constant. Those readings were then averaged and became the quadrature component at that frequency.
For these measurements I remembered to set the master oscillator frequency for each different choice. I wanted to make sure that the VNA tracked the same frequencies for each oscillator. I set up my ICOM 706MKIIG radio on the 15 MHz WWV signal, and then adjusted the VNA oscillator frequency in the software until the VNA RF output produced a 15 MHz signal which was on the same frequency as WWV. I found that I needed to increase the Valpey-Fisher frequency by 2 KHz, and lower the JITO-2 frequency by 1 KHz in order to get both units to track. In other words, when I used the Valpey-Fisher oscillator, I specified the value of 148.346 MHz in the software, as opposed to 148.344 MHz, the expected frequency. This change caused the VNA RF output to occur at 15 MHz when the software directed it to 15 MHz. The JITO-2 frequency was set to 148.343 MHz. In effect, this procedure discovers the actual oscillator frequency, not the frequency printed on the package. Once the actual frequency is known to the software, the synthesis of the RF and LO signals via the DDS chips will be very accurate, with respect to frequency.
The first filter I measured was the FL-232, which is a 350 Hz CW/Data filter. It has a published shape factor of 2.9, measured at the -6 dB and -60 dB points. The next graph overlays two Valpey-Fisher runs with one JITO-2 run. Other runs of each type were made, and their data agree with these representatives. The published center frequency of the crystal filter is shown as a vertical yellow line.
The sweep consisted of 641 frequency sample points, spaced at 5 Hz intervals. The sweep was centered around the published center frequency of 9.010600 MHz. Each sample was the average of 10 quadrature readings. The ADC in the VNA was running at the 220 conversion per second rate.
 |
| ICOM FL-232 Filter Response |
Within the majority of the transition band and passband, the response from both oscillators tracks very closely. The difference between oscillators shows up in the stopband, where the JITO-2 reported a signal level which was approximately 10 dB stronger than the Valpey-Fisher.
The graphic data suggests a -6 dB width of 380 Hz, and -60 width of 1010 Hz, a 2.66 shape factor. The published value are 350 Hz, 1015 Hz, and 2.9.
The raw filter data can be downloaded as the spreadsheet file SweepDataK14.xls.
The second filter I measured was the FL-223, which is a 1.9 KHz SSB filter. It has a published shape factor of 1.9, measured at the -6 dB and -60 dB points. The next graph overlays three Valpey-Fisher runs with two JITO-2 runs. Other runs of each type were made, and their data agree with these representatives. The published center frequency of the crystal filter is shown as a vertical yellow line.
The sweep consisted of 501 frequency sample points, spaced at 10 Hz intervals. The sweep was centered around the published center frequency of 9.011500 MHz. Each sample was the average of 10 quadrature readings. The ADC in the VNA was running at the 220 conversion per second rate.
 |
| ICOM FL-223 Filter Response |
Within the majority of the transition band and passband, the response from both oscillators tracks very closely. The difference between oscillators shows up in the stopband, where the JITO-2 reported a signal level which was approximately 10 dB stronger than the Valpey-Fisher, although in some cases much more.
The graphic data suggests a -6 dB width of 2060 Hz, and -60 width of 3080 Hz, a 1.5 shape factor. The published value are 1900 Hz, 3610 Hz, and 1.9.
The raw filter data can be downloaded as the spreadsheet file SweepDataK48.xls.
In the case of both filters, I spent a lot of time and energy making sure that the only aspect of the test that changed was the change in oscillator type. I repeated these measurements a number of times, and the oscillator difference shown on these graphs was always present, even if there were other small changes due to small adjustments of the test fixture.
At around the same time I was making these comparisons, N2PK made direct measurements of the phase noise present in the Valpey-Fisher, JITO-2, and the initial custom homebrew oscillator. His results are now available on his site.
I believe my measurements dovetail with the conclusions drawn by N2PK. The reflection measurement showed a very small difference, on the order of the error between measurements made on the same VNA. The transmission measurements, however, showed a greater difference. While the passband of the filters was categorized nearly the same by both oscillators, the reduced dynamic range with the JITO-2 compromised the true stopband attenuation of the filters.
Back to my March 2004 Group Build Page
Back to my Experimentation Page